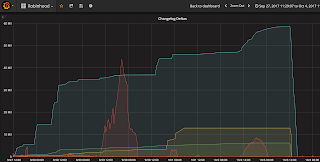
Cue an afternoon setting up influxdb (trivial) and grafana (also trivial) on a spare VM and a simple python script run on the metadata servers:
[admin@snx11038n003 ~]$ cat push_mdt_stats.py
#!/usr/local/bin/python2.7
import urllib
import time

def grabbit(mds):
 post = ""
 with open(('/proc/fs/lustre/mdt/%s/md_stats' % mds), 'r') as f:
    for line in f:
        k,v,null = line.split(None,2)
        if k == "snapshot_time":
            ts=int(float(v)*1000000)
        else:
            post += 'metadata,fs={3} {0}={1} {2}\n'.format(k,v,ts,mds)
 with open(('/proc/fs/lustre/mdd/%s/changelog_users' % mds), 'r') as f:
    tmp = f.read().split()
    # we can cheat here as they have the same format - 3rd item in list is current changelog count, and then
    # from the 6th item on we get changelog id / position to pull into a dict
    head = int(tmp[2])
    clog = dict(zip(tmp[5:][0::2], tmp[5:][1::2]))
    post += 'changelog,fs={2} head={0} {1}\n'.format(head,ts,mds)
    for cl,count in clog.items():
        post += 'changelog,fs={3} {0}={1} {2}\n'.format(cl,count,ts,mds)

 post=post.encode('ascii')
 p = urllib.urlopen('http://influxbox:8086/write?db=lustre&precision=u',post)
 #print(p.getcode())

while True:
  try:
    grabbit('snx11038-MDT0000')
  except:
    sys.exit("Whoa, that went a bit Pete Tong!")
  time.sleep(10)
And a couple of clicks in Grafana can soon knock up a dashboard:


