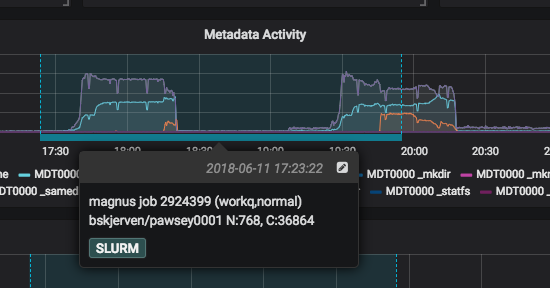
I've since written a small python script that talks to our SLURM accounting DB, so that given a jobID, we can get the start/end times and overlay those using the annotations API. One minor niggle in that the API expects epoch milliseconds, and seems to be tied to the TZ of the browser that generated the API key.
however...
~$ annotate_job 2924399Found the following job: User: bskjerven (pawsey0001) Cluster: magnus, Partition: workq, QOS: normal Nodes: 768, CPUs: 36864 Start: 2018-06-11 17:23:22, End: 2018-06-11 19:54:44Got something back - Annotate? (y/n) y200 - Annotation added
and lo - 

